Measurement of Poisson’s Ratio and Elongation for Polyvinyl Chloride (PVC)
●Introduction
PVC resins are a typical synthetic resin of polymerized chloroethene.
In terms of stand-alone properties, it has the drawback of being hard, brittle, and leaching chlorine atoms when exposed to ultraviolet rays, leading to yellowing deterioration. For this reason, in practical use, it is combined with plasticizers to increase flexibility and stabilizers to prevent deterioration, and is then heat-treated.
A variety of qualities from hard to flexible can be obtained by varying the type and quantity of such additives. As a result, the material has become common in a wide range of fields.
Applications include articles of clothing, interiors (cushion materials and heat insulating materials), ropes, wire sheaths,packaging materials, vinyl records, and water & sewer pipes.
In this report, strain is chosen as an example of a physical value showing the properties of typical PVC resin.
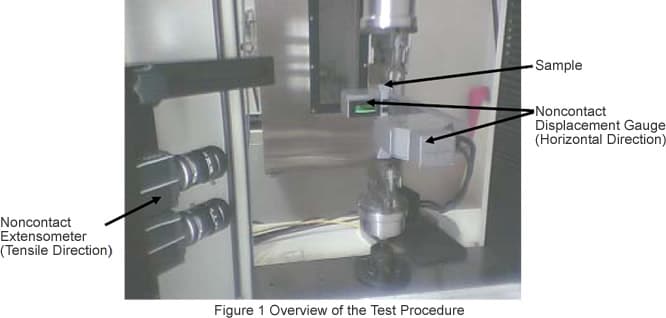
Strain is measured both in the tensile (vertical) direction and at right angles to the tensile direction (width = horizontal direction) using a noncontact displacement gauge and the Shimadzu precision universal tester Autograph AG-X.
Poisson’s ratio is then obtained using these results.
●Tester and Test Conditions
A typical PVC resin is used as the sample, and is shaped to JIS-1A specifications
(total length 150 mm, width of flat region 10 mm, depth 4 mm).
As shown in Fig. 1, this was mounted in the tensile tester (Shimadzu Autograph AG-X, 1kN capacity).
The elongation in the tensile direction (vertical) was measured using a video noncontact extensometer,
model DVE-201 (length between reference points 50 mm, reference line mark was automatically tracked by CCD camera image to measure the elongation).
Also, the deformation at right angles (in the width = horizontal direction) to the tension was measured using a noncontact displacement gauge (digital laser).
In terms of test conditions, the tensile test force was applied at a uniform loading speed of 1mm/min up to 500 N. Stress and elongation (vertical and horizontal) were then obtained. A total of five samples were used.

●Test Results
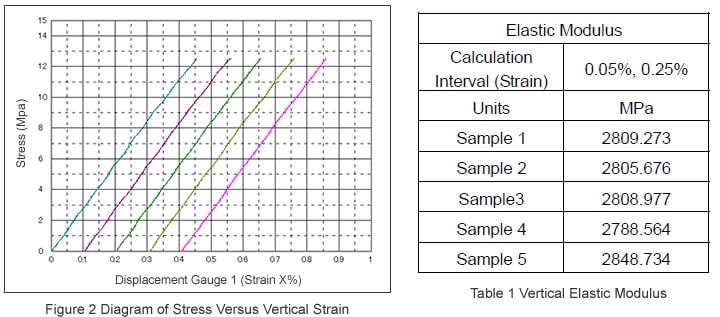
Fig. 2 is a diagram of “Stress versus Vertical Strain” for the five samples.
Table 1 shows the elastic modulus obtained from these results (elastic modulus is calculated from the slope between strain values of 0.05% and 0.25%).
It is evident from the results for the five samplesthat the data is stable with little variation.

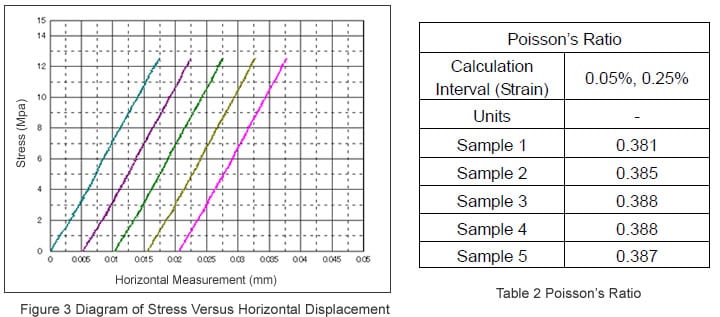
Fig. 3 is a diagram of “Stress Versus Horizontal Displacement” for the five samples.
Table 2 shows Poisson’s ratio, calculated from the abovementioned vertical and horizontal strain (as with elastic modulus, calculated from the data between strain values of 0.05% and 0.25%).
The data obtained from these results as well is as stable as for the elastic modulus.

As is evident from these results, accurate, stable material characteristics can be obtained even when a noncontact displacement measurement technique is used with no external force applied to the samples. This will therefore be extremely useful for development and quality control of a variety of resin products.


